Your Google Analytics
Partner in Asia Pacific
We are in the business of enabling actionable online
insights throughout this region
You have learned how to produce reports for management using the standard reports available in Google Analytics. You have even gone one step further and learned how to generate custom reports which are able to give you the exact data you need to provide insightful analysis to management.
You want to package summaries of your various custom reports into a single page or document that can be delivered to management on a scheduled basis.
 |
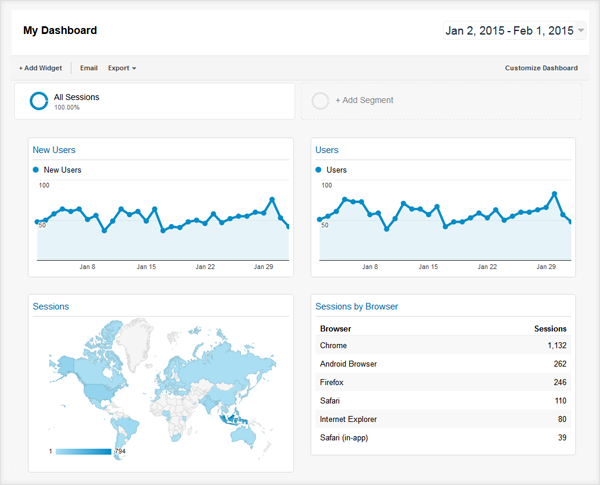
Google Analytics DashboardA dashboard consists of numerous widgets which can be a metric counter, table, pie chart, bar chart, etc… More importantly, each widget can be configured to display specific metrics and dimensions with specific filters applied. This is the same way you configure your custom reports. So, using the same settings as your custom reports, you can create widgets representing their summaries and put them onto a single dashboard. |
 |
Create Google Analytics DashboardJust go to your left menu and select Dashboards > New Dashboard. Your new dashboard screen will appear and you will be prompted to create new widgets. Experiment with creating these widgets. It is easiest to configure them following your favourite custom reports. Arrange the widgets around your dashboard. You can customize the dashboard layout as necessary. |
 |
Share Google Analytics DashboardLike the custom report, the data on the dashboard responds to your date range settings and any segments applied. So, it’s a useful place to see your favourite custom reports at a glance. Once you are satisfied with your dashboard, you can share it or email it to management where it will be attached as a PDF. If the dashboard is useful, you can set it up as scheduled email delivered to key stakeholders daily, weekly, monthly, etc… The email service is smart enough to set the correct date range based on the delivery schedule. |
Subscribe to our mailing list for the latest updates and quarterly insights from our research team.
Subscribe Now